Plot-Points
Interactive Mapping Tool
Bouwmeester, Johanna Marie, Coll of Arts, Media & Design
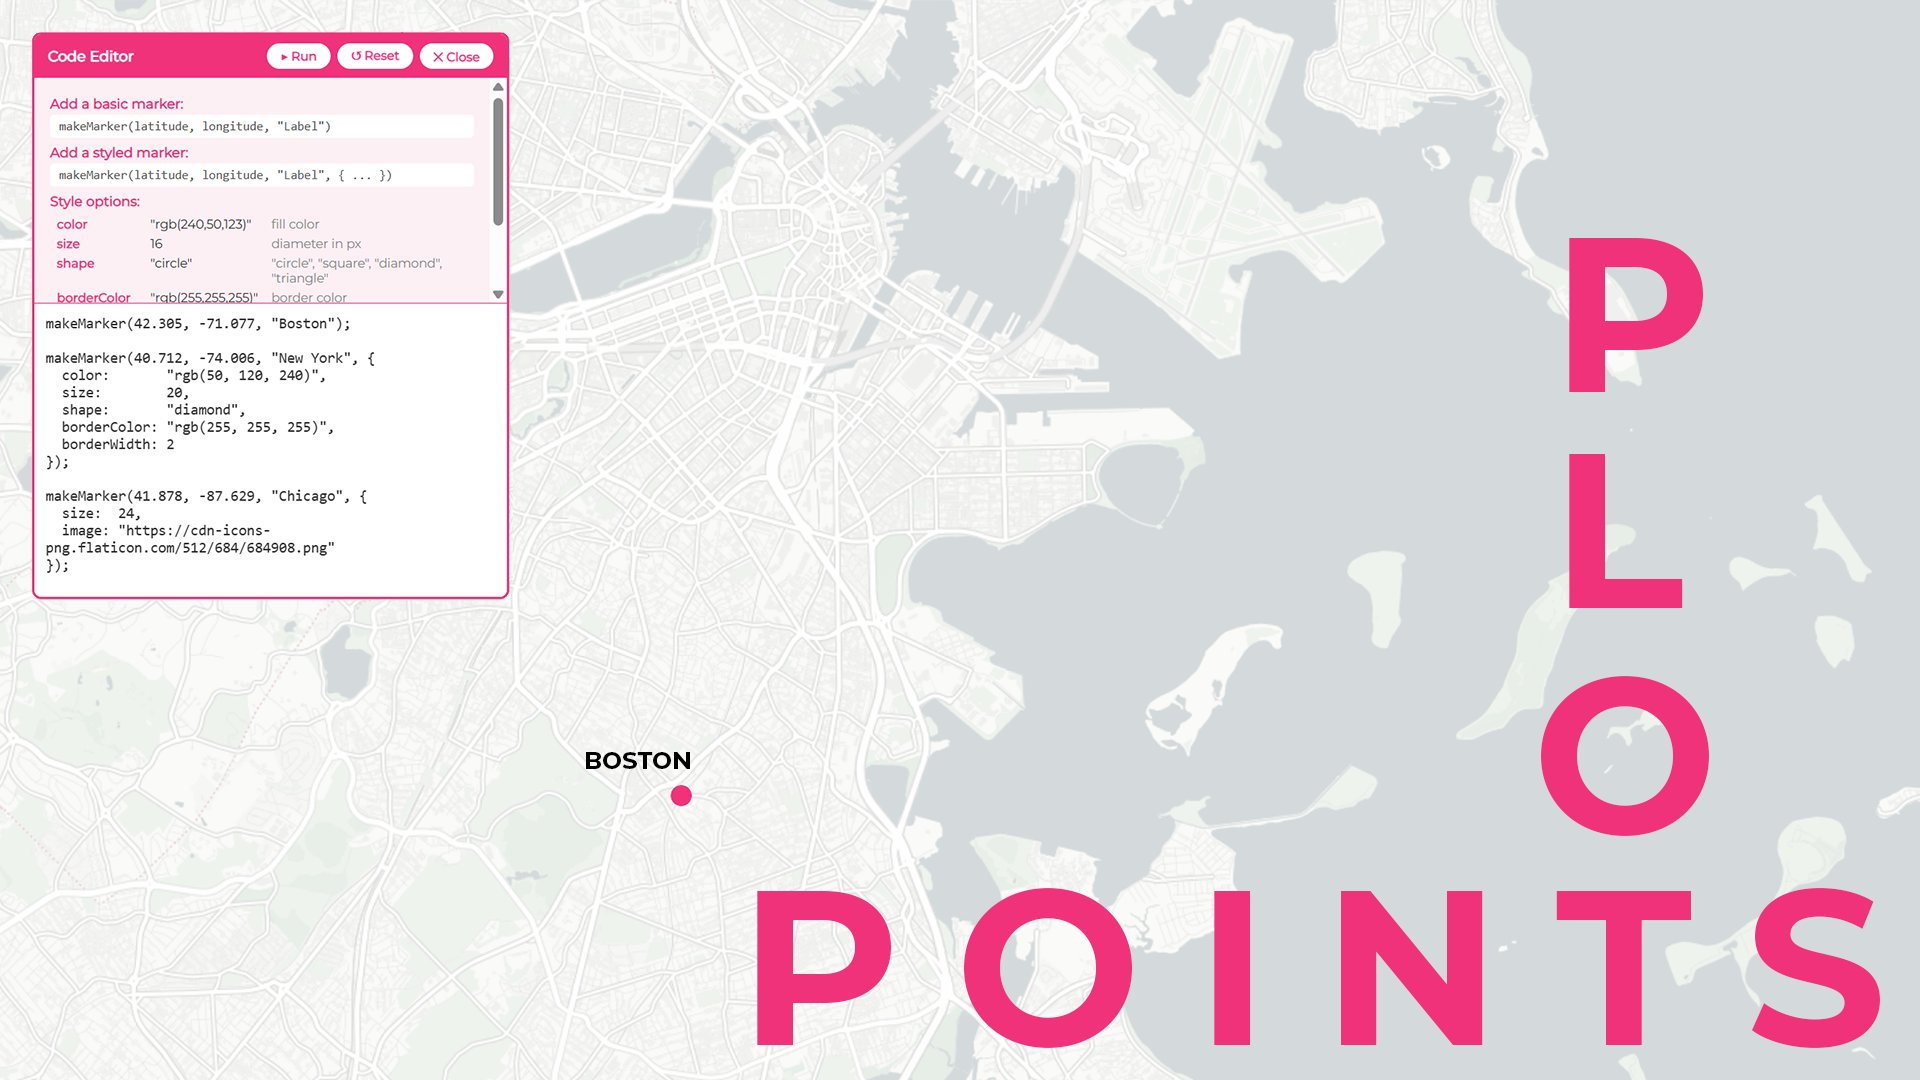
Plot-Points is an interactive web platform designed to make geographic data visualization accessible to designers without formal programming experience. The project was motivated by frustrations regarding the gap between having meaningful spatial data and the technical skills to present it visually — existing GIS tools are powerful but carry steep learning curves, while mapping libraries like Leaflet require significant coding knowledge. The central design question explored was: how do you make a coding-based tool feel approachable without sacrificing flexibility? The answer emerged through a layered interface — a polished map editor that conceals technical complexity, combined with exposed code editors that invite incremental customization. Rather than hiding code entirely, Plot Points treats it as a teachable moment, surfacing only the relevant parts through the Icon Editor and Map Editor panels with inline documentation and live feedback. The platform supports marker customization, tile layer switching, label overlays, presenter mode with a dynamic scale bar, PNG export, and embeddable iFrame generation — all bridging the gap between creative intent and technical execution. The key takeaway is that accessibility in technical tools is not about removing complexity — it is about revealing it at the right moment. Plot Points demonstrates that creative professionals can engage meaningfully with spatial data without needing to master a full GIS workflow first.